Providing Data
The Web Dashboard allows you to bind various dashboard items to data in a consistent manner, the only difference being the data sections that these dashboard items comprise. To learn more about common binding concepts, see the Binding Dashboard Items to Data topic.
This topic describes how to bind filter elements to data using the Web Dashboard control.
Binding Overview
All filter elements provide the Dimensions data section, which accepts dimensions used to provide filter values.
To bind the filter elements to data, click a placeholder contained in one of the available data sections and select the required data source field in the Binding section of the invoked data item menu.
To learn about the specifics of binding various filter elements to data, see the table below.
|
Dashboard Item |
Data Sections |
Description |
|---|---|---|
| Combo Box |
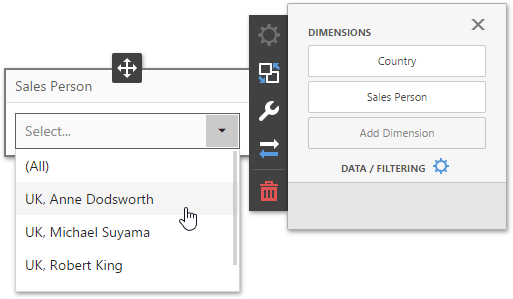
|
The Combo Box filter element can contain several dimensions at the Dimensions data section. In this case , the drop-down list will contain combinations of dimension values. |
| List Box |
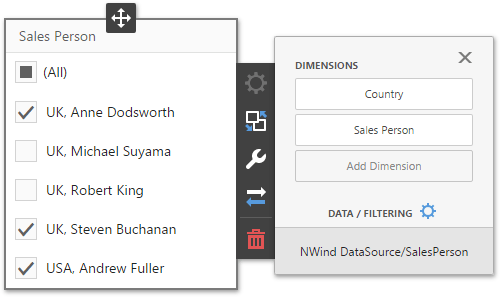
|
The List Box filter element can contain several dimensions at the Dimensions data section. In this case, the list will contain combinations of dimension values. |
| Tree View |
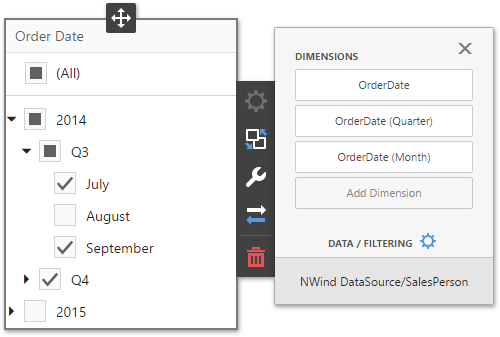
|
The Tree View filter element can contain several dimensions at the Dimensions data section. In this case, dimension values are displayed in a hierarchical way. This can be the set of dimensions with different group intervals (e.g., Year/Quarter/Month) or the set of related dimensions (e.g., geographical data such as continents/countries/cities). |
Create powerful mobile forms for your business in minutes