Asset Condition Assessment
Asset condition assessments are an example of how customers use Mobile Data Anywhere to create mobile data collection tools to collect data related to, and report on, the condition of a wide range of fixed and mobile assets.
An Asset condition assessment involves going into the field and visiting a number of assets including such assets as sites, buildings, plant and equipment, etc. For each asset information related to the asset must be collected and the condition of the asset needs to be accessed. Information that may be collected includes:
- Asset Location
- Asset Coordinates
- Photos
- General comments
- Condition
- Likelihood of Failure
- Consequence of Failure
- Risk Rating
- Priority
- Repair required
- Cost
- Any other number of custom data
Typically this type of Asset condition assessment would be performed with a combination printed asset lists, pen and paper a digital camera and a spreadsheet back in the office. The data that is collected when performing Asset condition assessments needs to be high quality and consistent. The typical approach of performing assessments with paper and pen and a camera does not allow for the real-time data needs and quality and consistency.
The Solution
A comprehensive tool like the one shown below can be created rapidly using the Mobile Data Anywhere platform. This data collection app allows a team of assessors to perform Asset condition assessments.
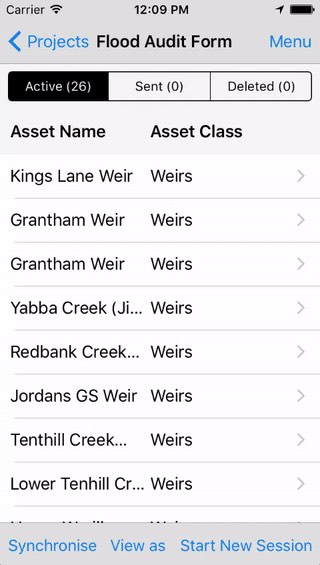
Prior to the Asset condition assessment a list of known assets can be uploaded into the form.
The list of assets that is uploaded can contain data for properties such as:
- Asset Id
- Name
- Description
- Category
- Coordinates
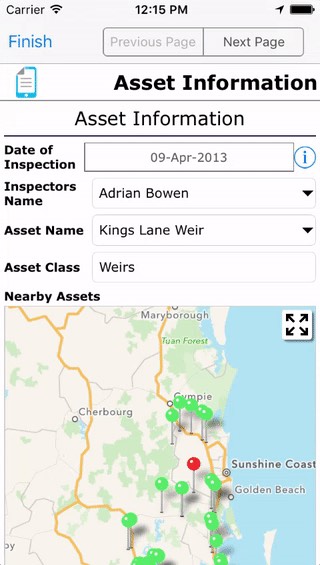
If the asset list contains the coordinates of the asset then the assets can be viewed on a map on the device and selected from a map based on where the person is located.
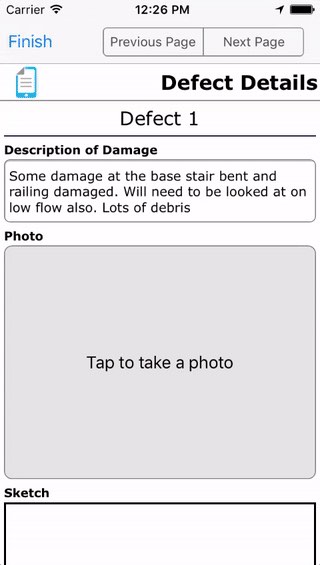
When collecting data photos can be taken of the damage and the images can be annotated by drawing on the screen.
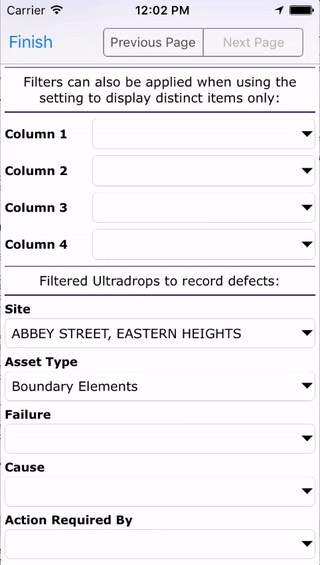
The asset can also be selected from a list which can be filtered down by Asset category.
When assessing the condition of the asset and whether it needs to be repaired, a risk calculation can be made out in the field by selecting entering the Likelihood of Failure, Consequence of Failure and calculating the Risk Rating.
Once the asset condition assessment data has been collected the next step is to ensure the quality of the data, and to analyse and report on the data and present to the asset owners. This can be down with a very basic excel export of the raw data. Or a simple export of the data to a KML file that can be loaded into a GIS application.
Below is an example of a KML export in Google Maps.

Data can also be analysed through the use of custom Dashboards. See the dashboard below to see how different asset categories and priorities can be analysed.

Complex reports can also be created using the Reporting tool, where multiple projects and data sources can be brought together to perform complex reports. Below is an example report with a line per asset with images and a summary of the data.

Mobile Data Anywhere can be used to:
- quickly create comprehensive mobile data collection apps to perform Asset condition assessments
- provide real-time up to date analysis of the data that is being collected.
- have predefined data from drop lists in the forms and Geospatial views of assets for easy selection.
- generate real-time comprehensive dashboarding and reporting to ensure high quality data collection throughout the assessment process.
- generate final reports in raw Excel or complex custom reports
