Dilapidation Surveys
Dilapidation surveys are an example of how customers use Mobile Data Anywhere to create mobile data collection tools to survey locations for defects prior to works commencing on a building.
An Dilapidation surveys involves going into the field and visiting a location where building work such as new home construction and renovations, infrastructure projects, road works or demolitions can result in building flaws in adjoining structures if the precautions aren’t appropriated.
An experienced building inspector will survey the property condition prior to works commencing and assemble a photographic document of pre-existing faults. Information that may be collected during the survey includes:
- Inspector Name
- Date of Inspection
- Building Name
- Address
- GPS Location of Building or Defect
- Asset Description
- Photo of Asset or Defect
- Location of Defect
- Photos of Defect
Typically this type of Dilapidation survey would be performed with a combination pen and paper a digital camera and a spreadsheet back in the office to produce a manual report in word or PDF. The data that is collected when performing Dilapidation surveys needs to be high quality and consistent.
The Solution
A comprehensive tool like the one shown below can be created rapidly using the Mobile Data Anywhere platform. This data collection app allows an inspector to perform Dilapidation surveys.
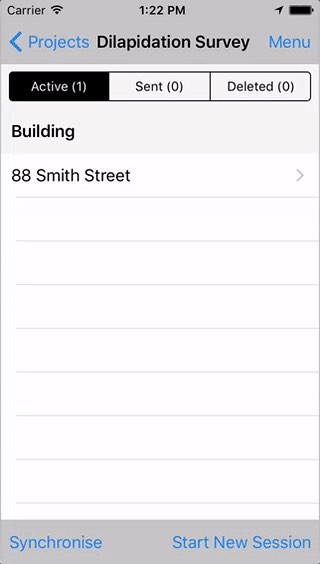
Once on site the Inspector will be able to move around the Building and assess any pre-existing damage.
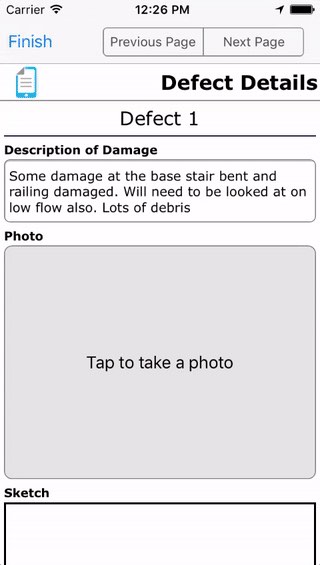
The inspector can select the current location from a list of predefined locations or enter in a new location and enter a description of the fault that has been found.
When recording information about a defect, photos can be taken of the damage and the images can be annotated by drawing on the screen.
Once the Dilapidation survey has been completed the next step is to ensure the quality of the data, and to analyse and report on the data and present to the owners of the property. This can be down with a very basic excel export of the raw data. Or a combination of Dashboards and Reports can be created to present to the owner.
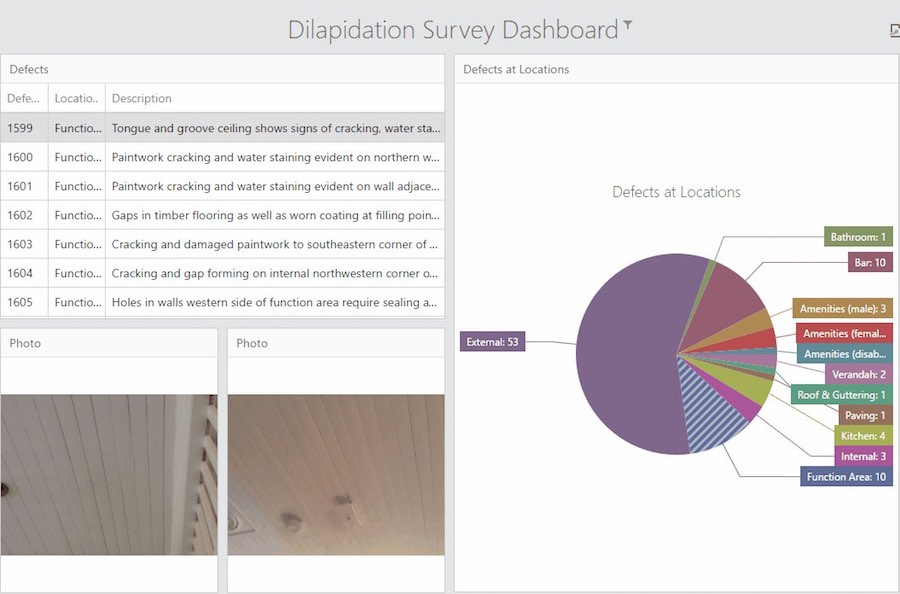
Data can also be analysed through the use of custom Dashboards. See the dashboard below to see how the number of defects per location can be displayed in a Pie Chart. And the person viewing the dashboard can also interact with it by selecting the Defects in a location and then selecting a specific defect to view the photos of the defect.

Complex reports can also be created using the Reporting tool. Below is an example report with a line per defect that has been found, which is grouped by location, with images and a summary of the data.
Mobile Data Anywhere can be used to:
- create comprehensive mobile data collection apps to perform Dilapidation surveys
- provide real-time up to date analysis of the data that is being collected
- generate interactive dashboarding and reporting to allow owners and inspectors to drill into the defects that have been found
- generate final reports summarising and detailing the defects found during the Dilapidation survey
Create powerful mobile forms for your business in minutes