Data Presentation Basics
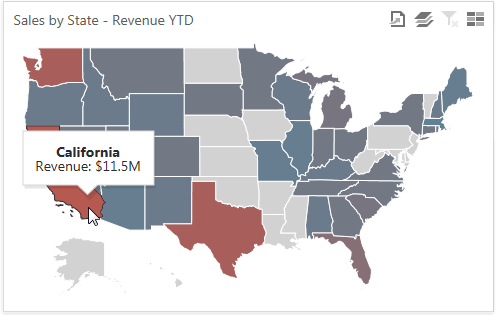
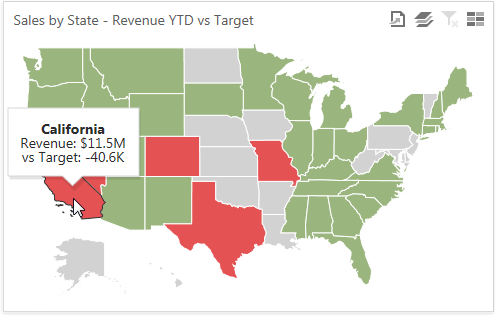
The Choropleth Map dashboard item colorizes map areas in two ways.
-
Based on the provided values.
-
Based on the difference between the actual and target values of a particular parameter.
You can switch between the provided values using the
Values
button (the
 icon) in the map's
caption.
icon) in the map's
caption.
Map Zooming and Scrolling
Use the following actions to scroll a map.
|
Operation |
Mouse |
Touch |
|---|---|---|
| Zooming | Use the mouse scroll wheel to change the current zoom level for the map. |
On a touchscreen device, use pinch or spread gestures to change the current zoom level.

|
| Scrolling | To scroll the map, hold down the left mouse button and drag it. |
On a touchscreen device, use flick gestures to scroll the map.

|
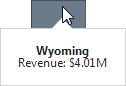
Tooltip
The Choropleth Map dashboard item can display a tooltip that shows information on a hovered area.
Create powerful mobile forms for your business in minutes