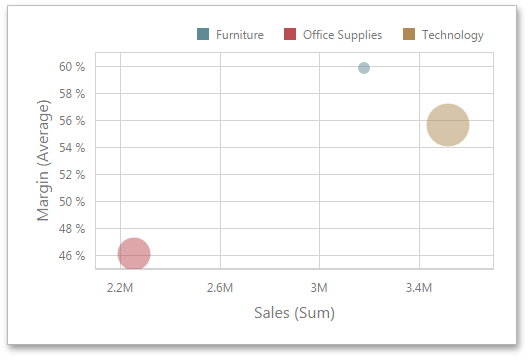
Data Presentation Basics
The Scatter Chart dashboard item visualizes summaries using three dimensions: the X-axis, the Y-axis and the size of data points.
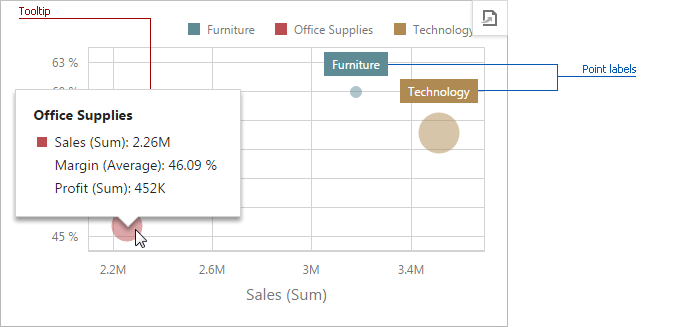
Point Labels and Tooltips
The Scatter Chart dashboard item can display point labels and tooltips that show information on data points. To see a tooltip, hover over the required point.
Create powerful mobile forms for your business in minutes
Copyright © 2026 Mobile Data Anywhere Pty Ltd | All Rights Reserved | Terms of Service | Privacy Policy