Providing Data
The Web Dashboard allows you to bind various dashboard items to data in a virtually uniform manner. To learn more, see the Binding Dashboard Items to Data topic.
The only difference is in the data sections that the required dashboard item has. This topic describes how to bind a Chart dashboard item to data.
Binding to Data in the Web Dashboard
The image below shows a sample Chart dashboard item that is bound to data.
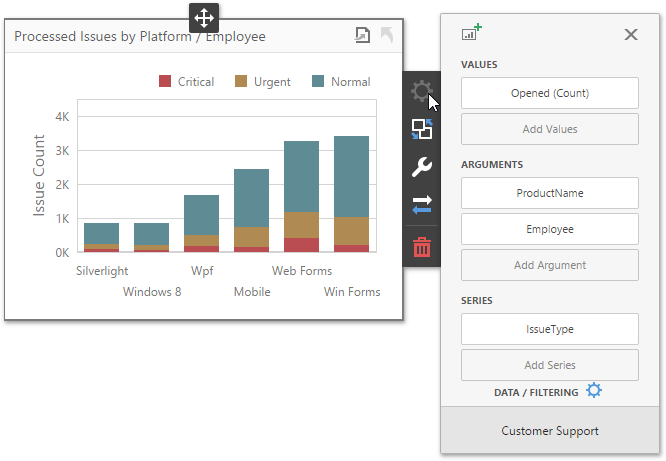
To bind the Chart dashboard item to data, click a placeholder contained in one of the available data sections and select the required data source field in the Binding section of the invoked data item menu.
The table below lists and describes the Chart's data sections.
|
Section |
Processed as |
Description |
|---|---|---|
| Values | Measure |
Contains data items against which the Y-coordinates of data points are calculated. The data item menu allows you to select the series type and specify different options.
Important
Note that some types of series accept several measures. To learn more, see the documentation for the required series type. |
| Arguments | Dimension | Contains data items that provide values displayed along the X-axis of the chart. |
| Series | Dimension | Contains data items whose values are used to create chart series. |
Create powerful mobile forms for your business in minutes