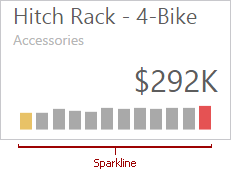
Sparkline
Sparklines can be used in cards to visualize the variation of actual (or target) values over time.
To display a sparkline within a Card, provide a date-time dimension whose data will be used to visualize values over time.
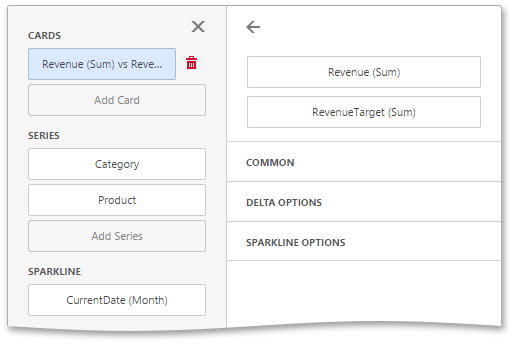
Note that if you have provided both actual and target values, a sparkline visualizes the actual value's variation over time.
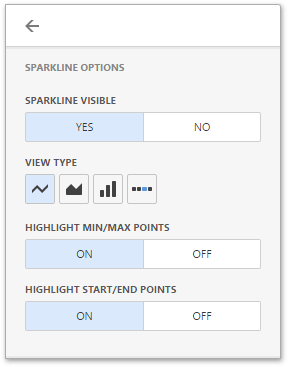
To control sparkline appearance settings, open the Sparkline Options section of the data item menu.
|
|
Create powerful mobile forms for your business in minutes