Panes
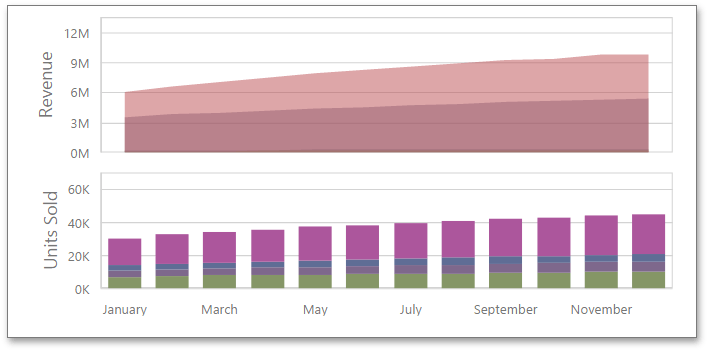
Panes are visual areas within a diagram that display chart series. The Chart dashboard item can contain any number of panes.
Each pane has its own Y-axis and displays a specific set of series. All panes in a chart share the same X-axis.
Add Panes
To add a pane, click the Add Pane button in the Chart's data item section.
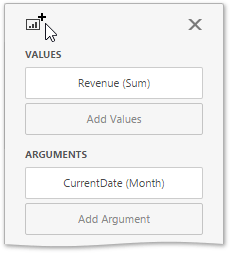
Once a new pane is added, the Web Dashboard creates another Values section. Use this section to provide data items that supply values to be displayed in the new pane (see Providing Data for details on data binding).
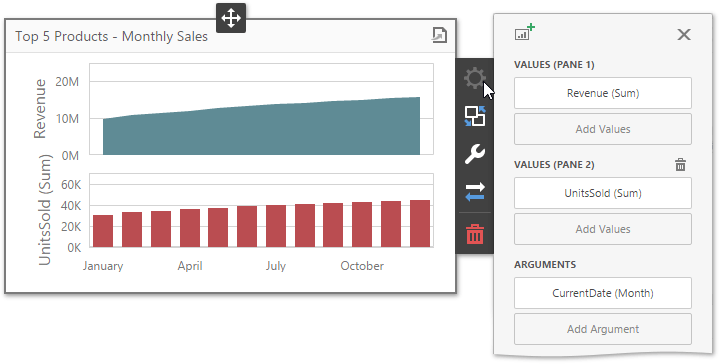
To remove a pane, click the Remove Pane button displayed in the added Values section.
Create powerful mobile forms for your business in minutes