Providing Data
The Web Dashboard allows you to bind various dashboard items to data in a virtually uniform manner. To learn more, see the Binding Dashboard Items to Data topic.
The only difference is in the data sections that the required dashboard item has. This topic describes how to bind the Pie Map dashboard item to data.
Binding to Data in the Web Dashboard
The image below shows a sample Pie Map dashboard item that is bound to data.
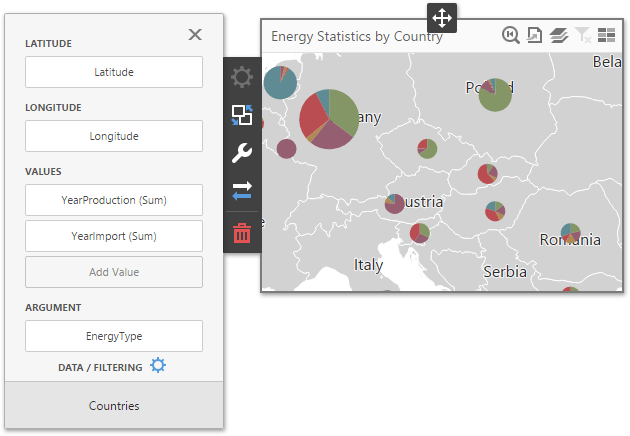
To bind the Pie Map dashboard item to data, click a placeholder contained in one of the available data sections and select the required data source field in the Binding section of the invoked data item menu.
The tables below list and describe the Pie Map's data sections.
|
Section |
Processed as |
Description |
|---|---|---|
| Lattitude | Dimension | Accepts a dimension used to provide geographic latitude. |
| Longitude | Dimension | Accepts a dimension used to provide geographic longitude. |
| Values | Measure | Accepts measures used to calculate pie values. |
| Arguments | Measure |
Allows you to provide data for pie arguments.
If you added a data item to the
Argument
section and several data items to the Values section, you can use the Values drop-down menu to switch between the provided values. To invoke the Values menu, click the
|
 icon in the
The Pie Map allows you to add supplementary content to tooltips to provide additional data.
|
Section |
Processed as |
Description |
|---|---|---|
| Tooltip Dimensions | Dimension | Accepts dimensions allowing you to add supplementary content to tooltips. |
| Tooltip Measures | Measure | Accepts measures allowing you to add summaries to tooltips. |
Create powerful mobile forms for your business in minutes